The problem: restaurants see orders, but not decisions
Traditional restaurant analytics are reactive.
You see:
What was ordered
What sold the most
Which tables spent more
What ingredients need restocking
But you almost never see:
What guests considered ordering
What they ignored
What attracted attention but failed to convert
Where guests got confused or lost interest
And that’s a huge blind spot.
Imagine running an online store without knowing which products people click on. Sounds absurd, right?
Yet thousands of restaurants do exactly that every day with their menus.
The truth is simple: the decision process matters just as much as the final order.
And this is where modern QR menus become incredibly powerful.
Metric #1: Dish View Rate
This is one of the most underrated metrics in restaurant analytics.
Dish View Rate tells you:
Which dishes guests open most often
Which items attract curiosity
Which photos or titles work
Which dishes nobody even notices
This metric alone can completely change how you structure your menu.
Why it matters
A dish can be your “best seller” simply because it’s visible.
Another dish may actually be more appealing, but hidden too low in the menu.
Restaurants often assume guests carefully read everything. They don’t.
Most guests scan quickly, compare a few options, and make fast emotional decisions.
If nobody opens a dish, it has almost no chance of being ordered.
Real example
Imagine two cocktails:
Signature Passion Martini
Tropical Sunset
Both taste great.
But one gets opened 4 times more often because:
The name sounds more premium
The photo looks better
The positioning is stronger
Without analytics, you’d never know.
With behavioral tracking, suddenly your menu becomes measurable instead of based on assumptions.
What smart restaurants do with this metric
They:
Reposition underperforming dishes
Change photos
Rewrite descriptions
Highlight profitable items
Test different category structures
This is exactly how e-commerce companies optimize online stores.
Restaurants are finally starting to do the same.
Metric #2: Time Spent on a Dish
This metric is incredibly revealing.
Because attention usually means interest.
If guests spend 20-40 seconds looking at a dish, something is happening psychologically:
They are considering it
Comparing it
Evaluating price
Looking at ingredients
Imagining the experience
And sometimes… they still don’t order it.
That’s where things become interesting.
High attention + low orders = hidden problem
This pattern often reveals friction.
For example:
The dish sounds attractive but overpriced
The photo creates expectations the description doesn’t support
The ingredients are unclear
The portion size feels uncertain
The dish lacks social proof
This is valuable information most restaurants completely miss.
The “hesitation effect”
Imagine a guest spending 45 seconds on a steak.
They zoom the photo.
Read the description twice.
Then order pasta instead.
Something blocked the decision.
Without analytics, you’ll never know this happened.
With behavioral insights, you can identify these “hesitation zones” inside your menu.
And once you find them, you can fix them.
Small changes can massively improve conversions
Sometimes the solution is surprisingly simple:
Better photo
Shorter description
Clearer ingredients
“Guest favorite” badge
Better placement
Wine pairing suggestion
Restaurants often focus on adding more dishes.
But sometimes the real money comes from improving how existing dishes are presented.
Metric #3: Category Drop-Off Rate
This metric tells you where guests lose interest.
And honestly, it can expose painful truths.
What is a drop-off?
A drop-off happens when guests:
Open a category
Scroll briefly
Leave it quickly
Move somewhere else
Or stop engaging entirely
This means the category failed to capture attention.
Why this matters
Many restaurant owners build menus based on internal logic.
Guests don’t think that way.
You may organize categories perfectly from an operational perspective, but guests experience the menu emotionally.
A category can fail because:
The first dishes look boring
Photos are inconsistent
Descriptions are too long
Prices feel confusing
There are too many options
The names sound generic
Sometimes the problem isn’t the food.
It’s presentation fatigue.
One of the biggest mistakes restaurants make
They overload categories.
Especially:
Pizza
Sushi
Cocktails
Breakfast menus
Guests open the section and suddenly face 40 nearly identical choices.
Instead of helping the guest decide, the menu creates stress.
And stressed customers often choose the safest, cheapest, or fastest option.
Or worse: they disengage completely.
Smart menus reduce cognitive overload
The best digital guest experiences guide decisions naturally.
Not aggressively.
Not manipulatively.
Just intelligently.
That means:
Better structure
Cleaner layouts
Strategic highlighting
Strong visuals
Fewer distractions
A good QR menu should feel like a conversation, not a spreadsheet.
The shift happening in restaurants right now
For years, QR menus were treated as simple digital replacements for paper menus.
Useful? Yes.
Transformational? Not really.
But that’s changing fast.
Restaurants are starting to realize something huge:
The menu is the closest thing they have to customer psychology data.
It shows:
Interest
Attention
Comparison behavior
Hesitation
Purchase intent
And unlike verbal feedback, this data is honest.
Guests don’t always tell you what they like.
But their behavior does.
How Oto helps restaurants understand guest behavior
At Oto, we believe a QR menu should do much more than display dishes.
It should help restaurants understand how guests make decisions.
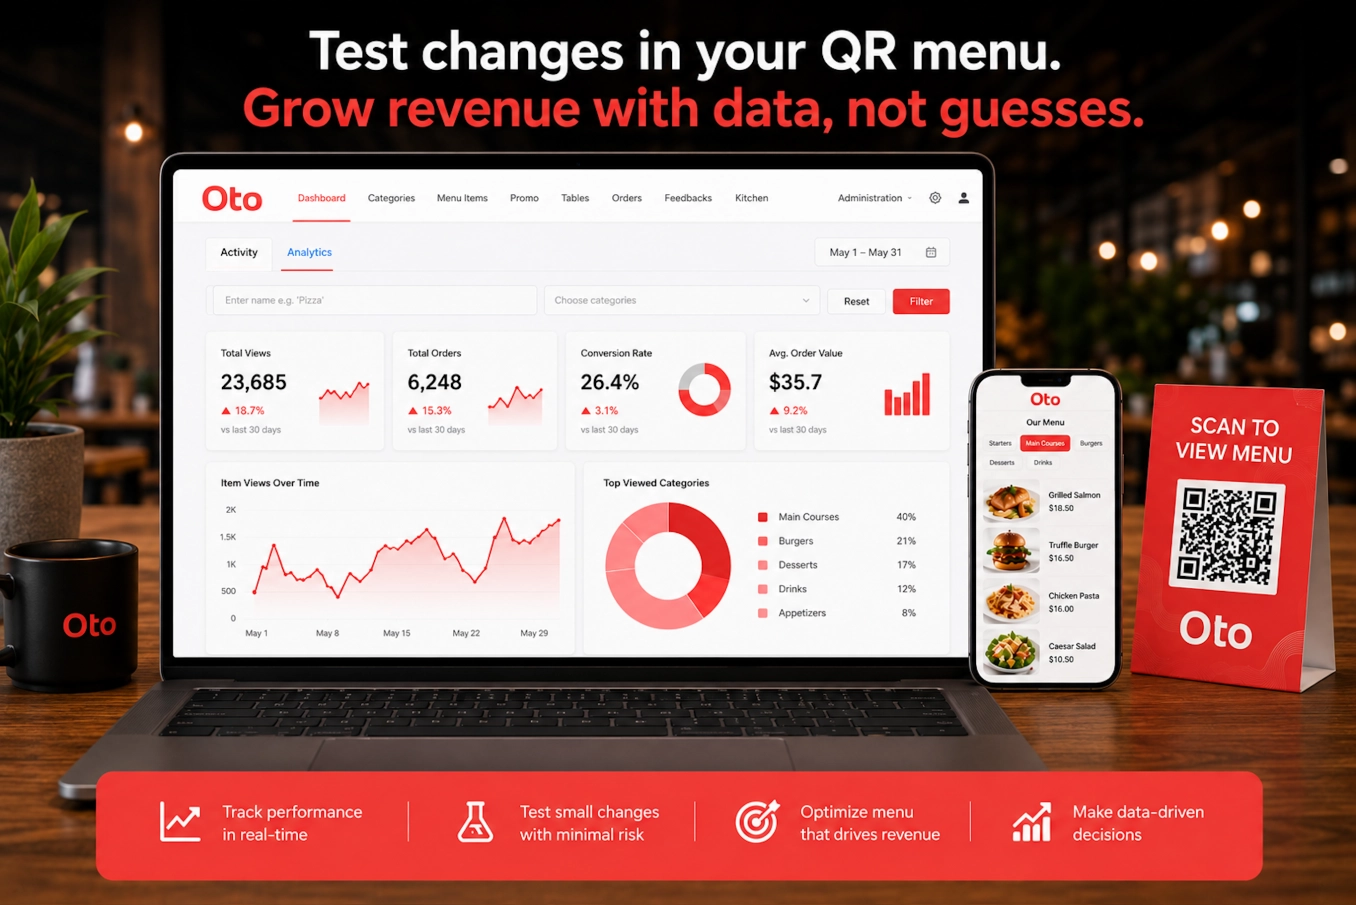
That’s why Oto is evolving beyond digital menus into a behavioral analytics platform for restaurants.
With Oto, restaurants can already:
Track menu engagement
Understand guest behavior patterns
Analyze dish popularity
Improve menu structure
Create multilingual digital guest experiences
Update menus instantly
Reduce operational stress for staff
And this is only the beginning.
Because the future of restaurant growth is not just about more customers.
It’s about understanding the customers you already have.
Final thoughts
Most restaurants still operate with incomplete information.
They know what was sold. But not why it was chosen.
That gap matters.
Because the restaurants that grow fastest in the next few years will not necessarily be the ones with the biggest menus or the lowest prices.
They’ll be the ones that understand customer behavior better than everyone else.
And surprisingly, the answers are often already sitting inside the QR menu.
Restaurants just need to start looking.
Try Oto
Want to transform your QR menu into a real customer intelligence tool?
Start using Oto and discover how behavioral analytics can help improve guest experience, optimize menus, and increase revenue.
FAQ
What is the most important metric for a QR menu?
There is no single metric that works for every restaurant, but Dish View Rate is often one of the most valuable because it reveals what actually attracts guest attention before orders happen.
Can QR menu analytics increase restaurant revenue?
Yes. Behavioral insights help restaurants optimize menu structure, improve dish presentation, reduce guest hesitation, and increase upselling opportunities.
Why are traditional restaurant analytics limited?
Traditional analytics usually show only completed sales. They rarely explain customer decision-making or reveal what guests considered before ordering.
How does Oto help restaurants analyze guest behavior?
Oto helps restaurants track menu engagement, dish popularity, guest interactions, and behavioral patterns inside the digital menu experience.
Are QR menus still relevant in 2026?
Absolutely. But the role of QR menus is changing. They are becoming behavioral analytics tools, not just digital copies of paper menus.