Know what guests think before they order.
Oto shows how guests look at, compare and hesitate over your dishes, and turns it into clear recommendations. No POS integration required.
What Oto sees before the order
From the first scan to the final order, every interaction with your menu becomes a signal Oto can learn from.
-
Attention
Menu views per day, views of each dish and category, scroll depth, time on a dish and photo clicks.
-
Comparison
Dishes opened together, dishes compared before ordering, when drinks are opened and what guests look at last.
-
Cart
Dishes added and removed, and the combinations guests choose most often, through Oto QR.
-
Context
Table, time of day, language, device and group size, so every insight fits the moment.
From insight to action
-
Attention vs. orders
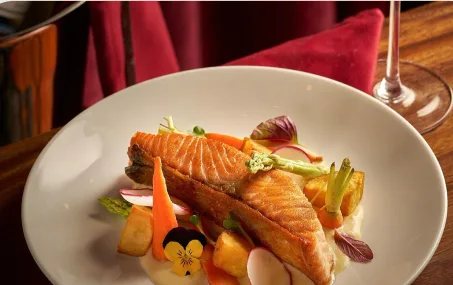
Grilled salmon is opened by 1 in 3 guests, but only 9% of them add it to the order, vs 21% for other mains.
RecommendationCheck the photo and the price against what guests expect.
-
Hidden hit
Chicken with vegetables is opened by only 1 in 8 guests, but 38% of them add it to the order, vs 19% for other mains.
RecommendationMove it higher in the list.
-
Price resistance
Beef tartare is opened often, but guests stay on it twice as long and 64% close it without ordering.
RecommendationTest a smaller portion at a lower price.
-
Menu dead zone
Only 1 in 5 guests reaches the bottom of Mains. Most stop after the first six dishes.
RecommendationMove your best-margin dishes onto the first screen.
-
Upsell opportunity
Guests who open the steak often open the wine list next, but only 12% add a glass.
RecommendationSuggest a matching wine on the steak page.
Guests don’t all behave the same
Oto splits what it sees by table, time of day, language and group, so patterns don’t get lost in an average.
-
By table
Which tables bring the highest average check.
Know where your best revenue sits.
-
By time of day
What guests look at at lunch, dinner or late evening.
Highlight the right dishes at the right moment.
-
By language
Which dishes each language group opens, and which it orders.
Fix photos and descriptions where guests hesitate.
-
By group
How larger groups browse compared with other guests.
Match what you offer to who is at the table.
See if your change worked
Oto doesn’t stop at the recommendation. Change one thing in your menu, then watch how guests react.
-
Look at today
See how guests use the dish or category now.
-
Change one thing
Swap the photo, rewrite the description or move the dish. Your menu updates in minutes.
-
Watch the behavior
Compare views, time on the dish and orders before and after.
-
Keep it or undo it
If it works, keep it. If not, go back and try something else.
See what your guests really do
Talk to our team and get a free demo of Oto for your restaurant.