The Real Problem: You Only See Orders, Not Decisions
Let’s be honest. Traditional menus are blind.
A paper menu tells you one thing: what people ordered.
But it hides everything that actually matters:
What caught their attention
What they considered but rejected
What they compared
Where they hesitated
What they never even saw
And that’s where money is lost.
Because between “view” and “order” is where the real story happens.
The Shift: From Static Menu to Behavioral Data
This is exactly where Oto changes the game.
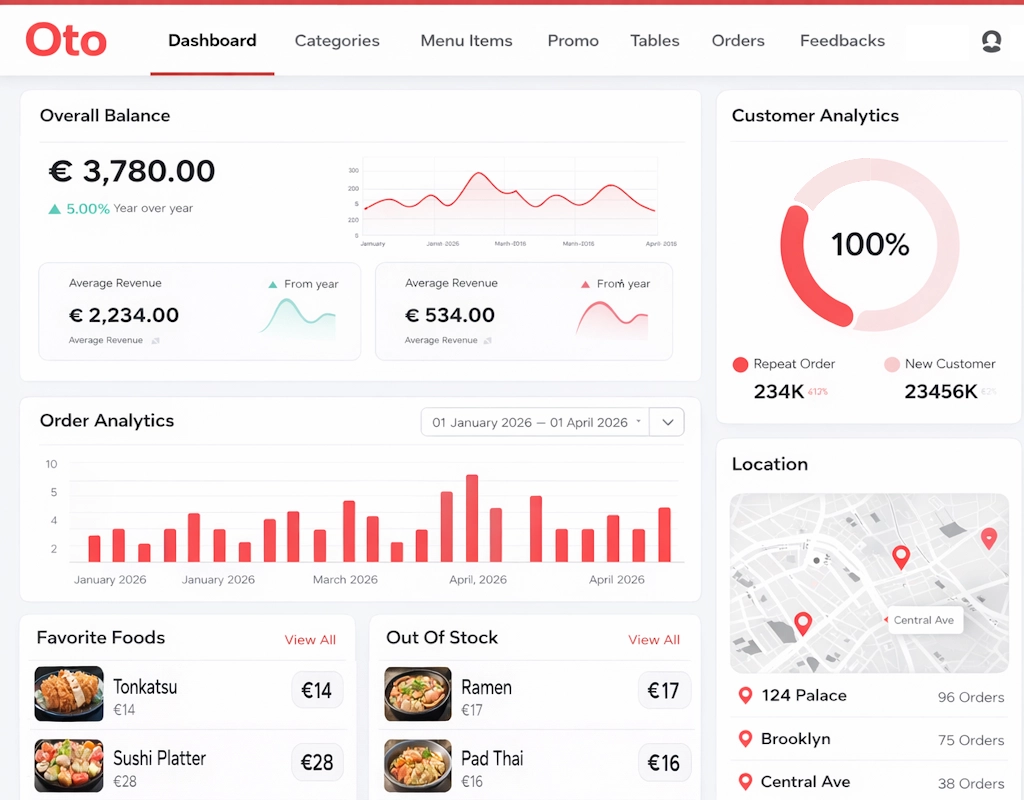
Instead of being just a QR menu, it becomes what you can think of as Google Analytics for your menu
Now you don’t just see orders.
You see behavior.
You start tracking:
Dish views
Time spent on each dish
Scroll depth
Clicks on images
What dishes are viewed together
What gets ignored
And suddenly, your menu stops being a PDF… and starts becoming a decision-making engine.
Most Viewed vs Most Ordered: Why This Gap Matters
This is one of the most powerful insights you can get.
Let’s break it down.
Case 1: High Views, Low Orders
Example:
Truffle pasta gets 3.2x more views than other mains
But is rarely ordered
This is not a success.
This is a problem.
It means:
The dish attracts attention
But fails to convert
Why?
Usually one of these:
Price feels too high
Photo is weak or misleading
Description doesn’t justify the cost
It’s placed in the wrong position
This is what we call friction.
Without data, you’d never spot it.
With Oto, it’s obvious.
What you do next:
Change the photo
Rewrite the description
Test a different position
Adjust pricing or portion messaging
Case 2: Low Views, High Orders
Now the opposite.
Example:
Chicken soup is rarely opened
But has the highest conversion rate (38%)
This is a hidden gem.
It means:
People who find it almost always order it
But most guests never see it
That’s lost revenue sitting in your menu.
What you do next:
Move it higher
Highlight it
Add a visual
Include it in combos
Case 3: High Views, High Orders
This is your star.
People notice it
People order it
These are your revenue drivers.
But even here, data helps:
What do guests view together with it?
Can you upsell something next to it?
Example:
Guests who open burgers also view craft beer 41% of the time
That’s not random.
That’s a pattern.
Action:
Recommend craft beer right under the burger.
Simple.
Case 4: Low Views, Low Orders
These are your “dead zones.”
Nobody looks
Nobody orders
And yet they take space.
Oto often reveals something shocking:
Guests stop scrolling after 10–12 dishes.
Everything below that? Invisible.
What you do next:
Cut the menu
Move high-margin items up
Reduce clutter
The Missing Layer: Understanding Intent
Here’s where it gets really interesting.
With advanced tracking, you don’t just see views.
You start understanding intent:
What people compare
How long they hesitate
When they switch categories
When they look at drinks
What they check before deciding
If you add a soft “Add to cart” or “Send order” action, you get even closer:
Most added dishes
Abandoned choices
Popular combinations
Now you’re not guessing anymore.
You’re reading the customer’s mind.
Real Insight Example (And Why It Matters)
Let’s say your data shows:
Steak page = 2x longer time spent
But very low conversion
This is classic.
People want it.
But something blocks them.
Most likely:
Price resistance
That’s not a menu issue.
That’s a positioning issue.
Fixes:
Add social proof (“most popular premium dish”)
Improve description (justify value)
Add pairing (wine recommendation)
Test price anchoring
Without data, you’d just assume:
“Steak isn’t popular.”
But that’s wrong.
The Bigger Picture: Menu as a Revenue System
When you combine all these insights, something shifts.
Your menu is no longer:
A list of dishes
It becomes:
A sales funnel
You start thinking in terms of:
Conversion rate
Attention vs action
Behavioral patterns
Revenue optimization
The Oto Approach: Not More Data. Better Decisions.
Here’s the trap many restaurants fall into:
They get data…
and drown in it.
Oto avoids that.
Instead of dashboards full of numbers, it focuses on answers:
“Your burger attracts attention but doesn’t convert. Improve the photo.”
“Guests stop scrolling after dish #9. Move high-margin items up.”
“Pizza + tiramisu are viewed together in 41% of sessions.”
This is not analytics for analysts.
This is practical guidance for busy restaurant owners.
Why This Changes Everything
Restaurants have always operated with incomplete information.
You saw:
Sales
Revenue
Orders
But you never saw:
Decision-making
And that’s where growth lives.
With Oto, you finally understand:
What attracts attention
What converts
What creates doubt
What gets ignored
Over time, this builds something even more powerful:
Benchmarks
Patterns across restaurants
Proven menu structures
The Long-Term Advantage
This is not a small improvement.
This is a structural shift.
Restaurants using behavioral data can:
Increase menu conversion by 15–30%
Improve average check
Reduce guesswork
Optimize faster
And most importantly:
They stop making decisions based on intuition.
Try Oto
If you still rely on a paper menu, you’re missing 90% of the story.
You see the result.
But not the journey.
Oto gives you that missing layer.
And once you see it, you can’t go back.
Start turning your menu into a revenue engine:
https://otoqr.app/en/register
FAQ: Customer Behavior & QR Menu Analytics
What is the difference between most viewed and most ordered dishes?
Most viewed dishes attract attention. Most ordered dishes drive revenue. The gap between them shows where guests hesitate or lose interest.
Why do some dishes get many views but few orders?
Usually due to price perception, weak visuals, unclear descriptions, or poor placement in the menu.
Can a digital menu really increase sales?
Yes. By optimizing based on real behavior data, restaurants typically improve conversion rates and average order value.
How does Oto track customer behavior?
Oto tracks interactions like dish views, time spent, scroll behavior, clicks, and combinations viewed, creating a full picture of guest decision-making
What is the biggest advantage over a paper menu?
A paper menu shows only final orders. Oto shows the entire decision process, which is where most revenue opportunities are hidden.